We have been getting very excited about infographics here and have discovered a lot of great models for beautifying and clarifying information. If the term is new to you, here is a simple definition from wikipedia: “infographics are graphic visual representations of information, data or knowledge. These graphics present complex information quickly and clearly…” Watch the below video for a comprehensive description of what these newfangled graphics do and when to use them.
The Value of Data Visualization from Column Five on Vimeo.
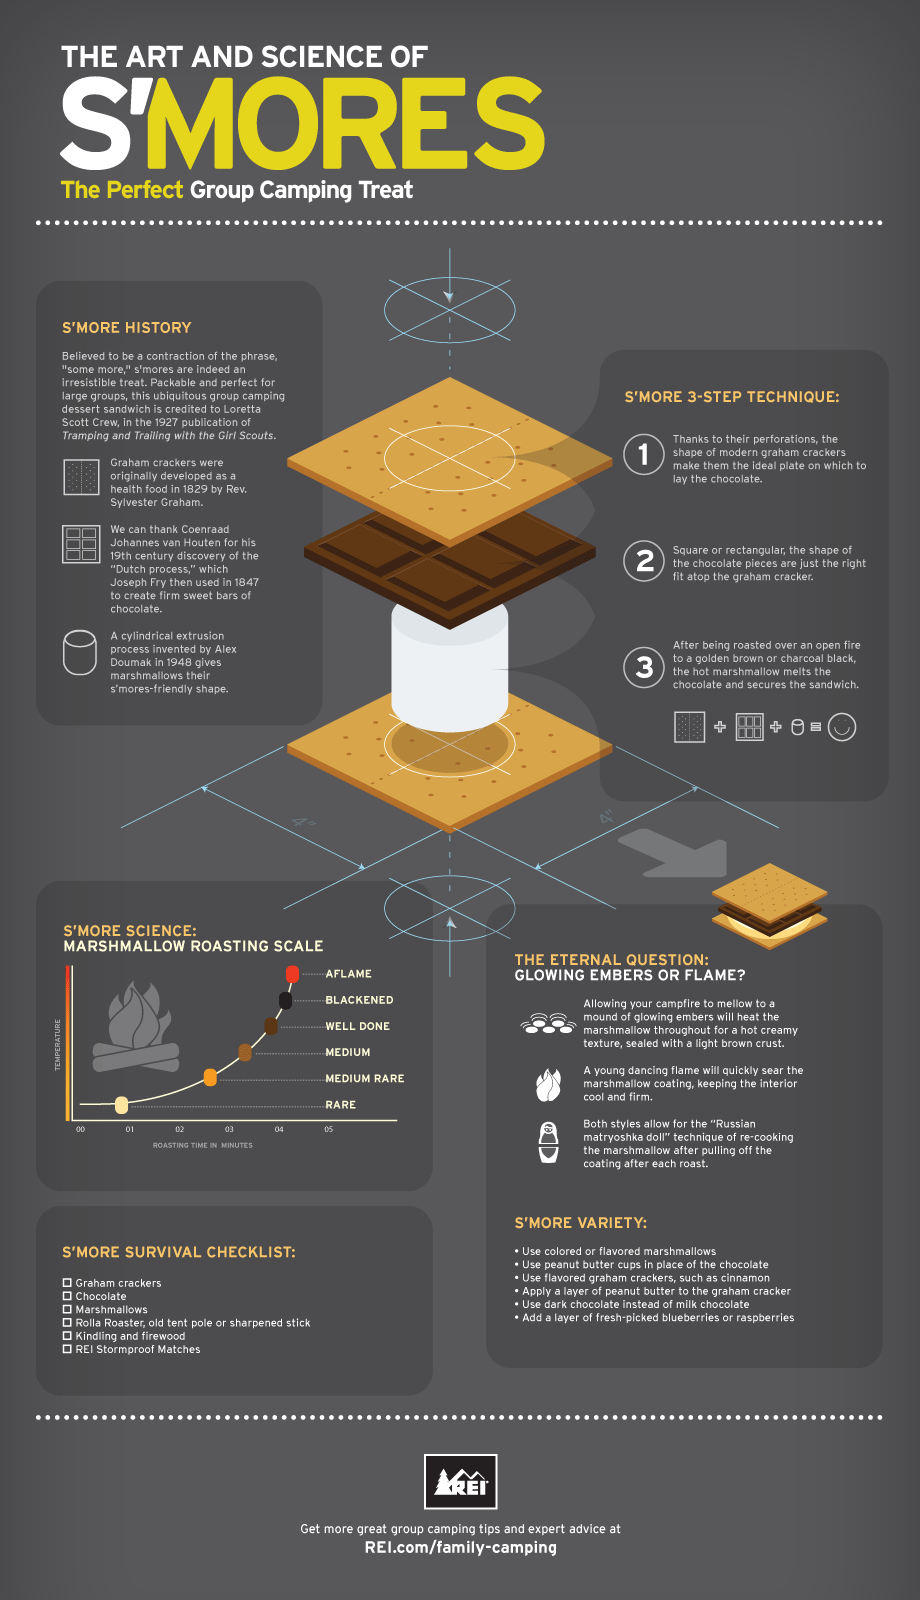
We have been scouring the web for inspiration for some infographics of our own and have found that there is a plethora of examples out there. Blogs like Daily Infographic, Cool Infographics and GOOD.is all feature graphics found around the web. Here is a favorite from REI, the sporting goods store.